Thermography in Electrical Maintenance: Benefits and Best Practices
Thermography in electrical maintenance helps us spot hidden electrical issues before they turn into downtime, injuries, or expensive repairs. In the first place, infrared imaging lets our team see heat patterns that normal inspections miss. As a result, we reduce risk, improve uptime, and support safer operations across commercial and industrial facilities. At Kord Electric, we pair proven thermography methods with clear reporting, so other stakeholders do not need a secret decoder ring. And yes, while some problems look calm from the outside, heat often tells the truth. Our expert service staff explains what they see, why it matters, and what we recommend next, step by step.
How Kord Electric uses infrared thermography on electrical panels
In many facilities, we begin by reviewing the electrical system map and maintenance history. Then we plan the inspection route so our technicians can capture consistent readings across key components. Next, we verify conditions such as load level, ambient temperature, and whether equipment recently cycled. That matters because thermography in electrical maintenance works best when the thermal picture matches real operating conditions.
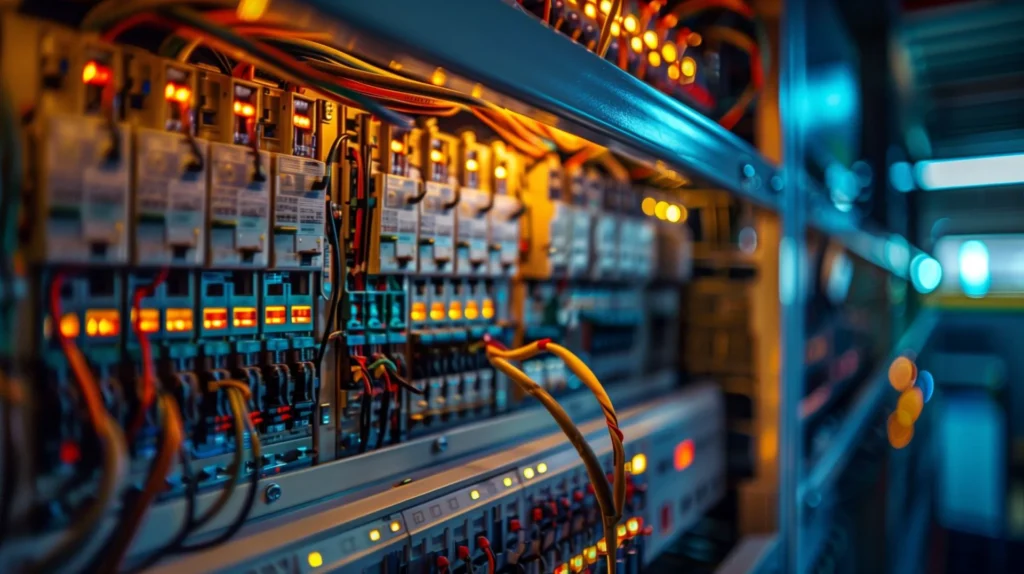
During the scan, our team checks common hotspots such as terminations, bus connections, breakers, lugs, and motor control circuits. We also look beyond the obvious. For example, a cable run may look fine during a walkthrough, yet heat can reveal loose connections or insulation stress. At the same time, our technicians document where each thermal pattern appears, not just that a component “looks warm.”
Now, here is where our expert service staff keeps the process grounded. We do not hand over images and vanish like a magician. Instead, we explain what the thermal results likely indicate, what other checks we recommend, and what actions reduce the chance of failure. If a story sounds too good to be true, we still confirm it. Heat is data, not a guess.

Infrared inspections also fit naturally into broader preventive programs like structured electrical maintenance and reliability planning. When we pair thermal imaging with targeted testing and visual checks, facility teams get a more complete picture of risk instead of betting everything on a single inspection method.
What thermal anomalies usually mean in industrial electrical systems
Thermography in electrical maintenance does not diagnose everything by itself, but it narrows the field quickly. When we spot abnormal heat, it often points to one of several conditions. First, it can indicate loose connections. Heat builds where resistance rises, and resistance rises where contact quality drops. Second, it can suggest damaged insulation or failing components that produce uneven heat distribution.
We also see issues related to phase imbalance and overloaded circuits. For instance, one phase may run hotter than the others even when the equipment seems to operate normally. As workloads shift through the day, these patterns become clearer. Moreover, thermal imaging can highlight problems in control wiring, where loose contacts may not trip protection devices yet.
In practical terms, our team often compares the temperature of similar components. Then we look at the heat gradient, meaning how temperature changes across the surface and around the connection. That approach supports better decisions. Otherwise, a single high reading might confuse the matter, like finding one “suspicious” star in the sky without knowing the constellation.
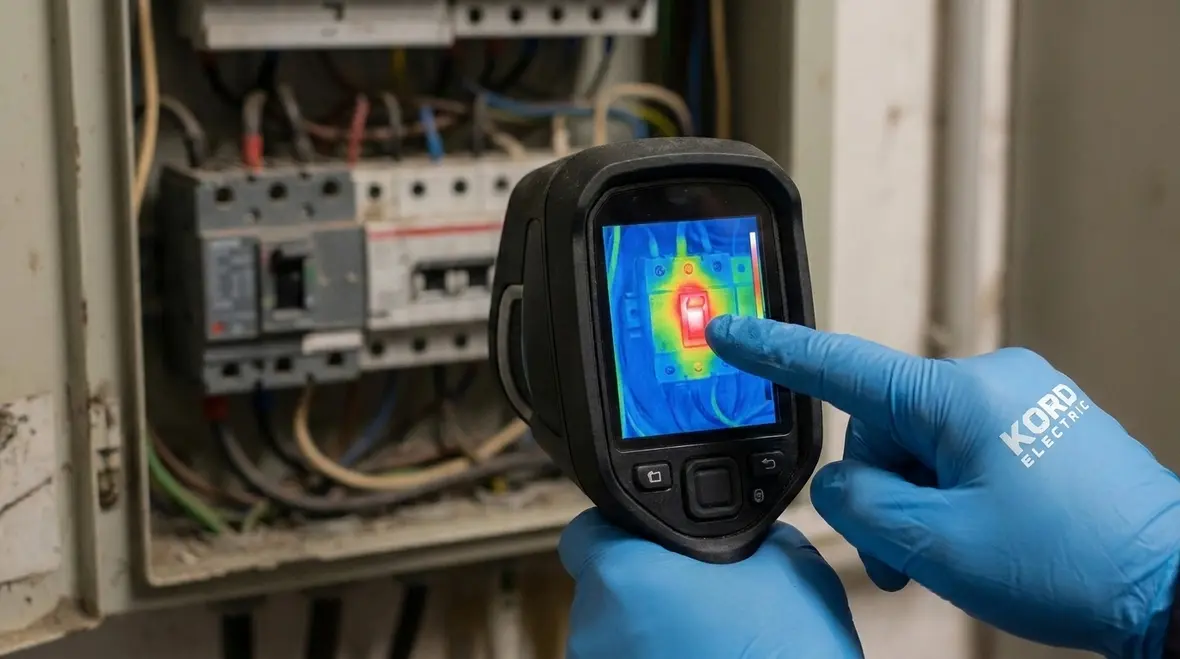
When we interpret anomalies, we also consider the equipment’s job. A slightly warm breaker feeding a lightly loaded circuit may not mean much on its own. That same pattern on a heavily loaded feeder, combined with discoloration or audible noise, could point to a problem that deserves fast attention.
Benefits that show up fast in reliability and safety
For commercial and industrial facilities, the best maintenance plan does not only prevent failures. It also protects people and budgets. Thermography in electrical maintenance helps us reach that goal by catching problems early. When we find issues before they escalate, we reduce emergency callouts, limit production interruptions, and lower the chance of secondary damage.
Safety benefits matter too. Hot spots can lead to arcing, melted insulation, and thermal runaway. Therefore, we treat heat anomalies as risk signals, not minor annoyances. Additionally, we support documentation for maintenance records, internal audits, and insurance requirements, when applicable. In other words, we help other teams prove that they manage risk, not just that they react to it.
And we keep the conversation realistic. We know property managers sometimes ask for a simple yes or no. Yet electrical systems rarely offer “easy mode.” Our technicians explain the findings clearly, then we agree on action levels and timing. That means fewer surprises later, and fewer late night emails that start with “Quick question…”
Thermographic data also helps align stakeholders. When owners, facility teams, and safety managers look at the same images and temperature trends, it becomes easier to justify planned repairs instead of deferring them until something fails in the middle of a busy week.
Applications across power distribution, motor circuits, and switchgear
Our focus stays on commercial and industrial electrical infrastructure, including major property buildings. Within that scope, we apply thermal imaging where failures hurt the most. For power distribution, we inspect switchgear, switchboards, panels, and bus bars. We pay special attention to connection points because that is where resistance often forms.
For motor circuits, we look at starters, contactors, disconnects, and motor control wiring. Even small connection issues can create heat that worsens with load. Then, over time, the heat pattern may change as parts wear. By scanning on a schedule, we can track trends instead of relying on one snapshot.
We also use infrared imaging in facilities with complex electrical needs, including large HVAC systems, pumping stations, and process equipment. If operations include frequent production cycles, we coordinate inspection windows around load conditions. That way, we capture meaningful thermal behavior. In short, we match the technique to the equipment, not the other way around.
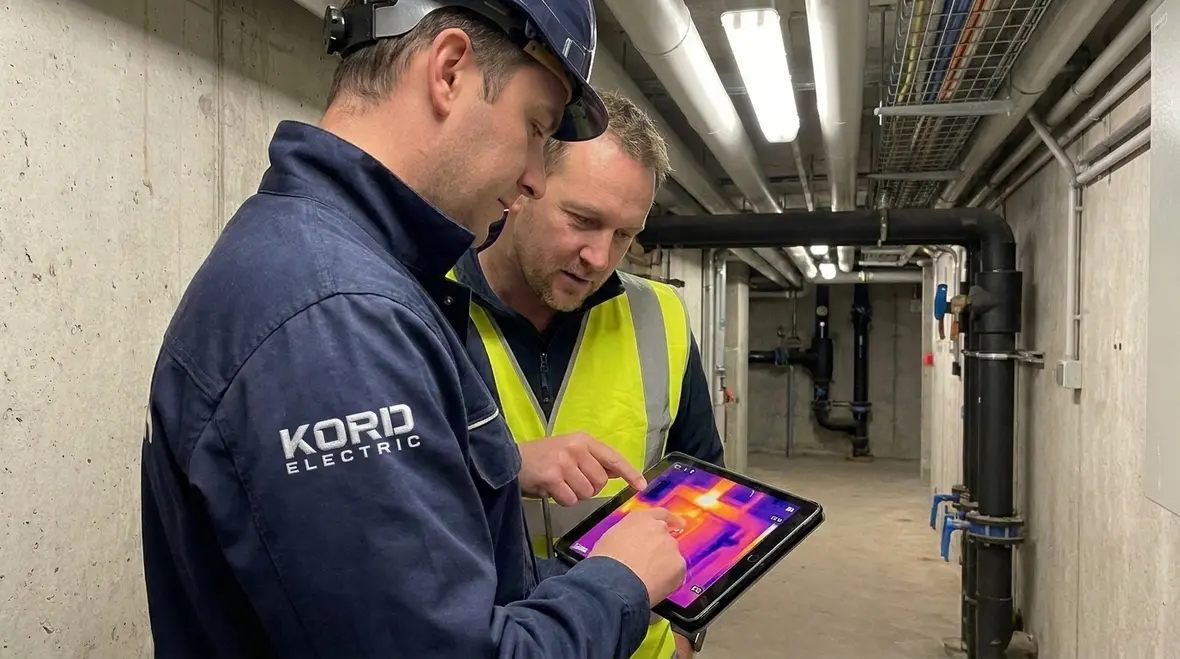
These same methods support other reliability projects too. For example, when facilities upgrade distribution equipment or add new critical loads, thermography provides a way to confirm that the new configuration runs smoothly once everything is online.
Best practices that improve accuracy and reduce false alarms
Accuracy makes or breaks any infrared plan. So we follow best practices that our technicians can repeat across sites. First, we schedule inspections at consistent load conditions when possible. Then we account for factors that affect readings such as surface emissivity and reflected heat. We also inspect during steady operation rather than right after major load changes.
Next, we document camera settings, environmental factors, and equipment details. This keeps the comparisons valid over time. We also follow a disciplined approach to image capture, ensuring clear views of terminals and connection surfaces. Blurry images do not help anyone, and we do not pretend they do.
After the scan, we interpret results with a method that ties heat patterns to electrical function. Therefore, we avoid overreacting to every warm spot. Instead, we set priorities for investigation and repair based on severity, location, and how the equipment behaves. Our expert service staff then explains each recommendation in plain terms, so stakeholders understand why we chose a response level.
And yes, we know people sometimes treat thermography like a horoscope. “The panel says trouble is coming.” That is not our style. We confirm with follow up checks when needed, and we connect the findings to maintenance actions. When appropriate, we also relate thermal results to other condition-based tools so the maintenance plan stays grounded in real data.
For facility teams that want a deeper dive into how thermal findings connect with broader maintenance strategies, resources like Kord Electric’s guide to electrical infrared thermography services and preventive maintenance planning can reinforce what on-site inspections uncover.
What a thermography report looks like for owners and facility teams
Owners and facility leaders need clarity, not a wall of confusing images. For that reason, our reporting emphasizes actionable results. We include a summary of the scanned areas and list findings by location and component type. Then we highlight thermal anomalies and connect them to likely causes, along with suggested next steps.
In addition, we support decision making with a practical maintenance view. We group recommendations based on urgency and impact to operations. For example, we prioritize findings that indicate high risk at critical connections. Then we note lower risk items that can wait until the next scheduled outage. That approach helps teams plan labor, parts, and shutdown windows.
We also support follow through. Our technicians often recommend targeted inspections, torque verification, cleaning, or replacement of specific components depending on what the thermal evidence suggests. After repairs, we can conduct follow up scans to confirm the problem declined. That closes the loop. In the end, thermography becomes a management tool, not a one time event.
When reports link clearly to electrical distribution diagrams and asset lists, they also help new team members understand the system faster. Instead of guessing where a finding lives, maintenance staff can go straight to the right gear, panel, or termination and act with confidence.
FAQ
Planning next steps for Thermography in Electrical Maintenance: Benefits, Applications & Best Practices
If your electrical system runs critical operations, do not wait for a failure to teach you a lesson. Kord Electric delivers Thermography in Electrical Maintenance: Benefits, Applications & Best Practices with clear findings, practical recommendations, and follow through from our technicians and expert service staff. We focus on commercial and industrial facilities and major property buildings, so your risks get managed where they matter most.
For facilities across Southern California, especially those relying on complex distribution, process loads, and continuous operations, pairing thermography with structured preventive service through dedicated Los Angeles County electrical services for commercial and industrial sites builds a stronger reliability baseline. Thermography becomes one of the tools that keeps uptime steady instead of a one off project you forget about after the first report.
To keep your maintenance plan aligned with future projects, you can also review related resources like Kord Electric’s electrical infrared thermography services guide, which explains how thermal inspections integrate with broader electrical maintenance, panel upgrades, and reliability improvements across your sites.
Contact us to schedule an infrared inspection, build a thermography schedule that fits your operations, and get a maintenance plan that stays ahead of the heat instead of chasing surprises after hours.