Preventative Infrared Thermography for Facilities
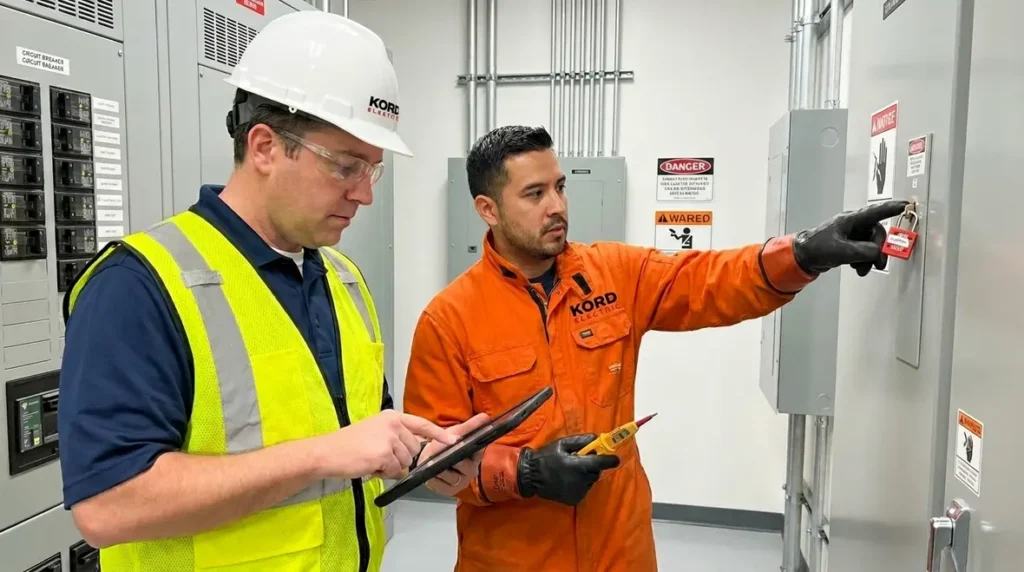
Kord Electric uses preventative infrared thermography testing to help commercial and industrial facilities spot electrical problems before they turn into outages, fires, or expensive downtime. In other words, we look for what you cannot easily see, then we act while the damage is still small. Our technicians and expert service staff explain what they find in plain language, because maintenance should not feel like a mystery novel. And yes, sometimes the readings look “too hot to handle,” like a scene from a blockbuster, except the villain is heat buildup, not a super villain.
Why hidden electrical hazards cost more in commercial and industrial work
In commercial and industrial facilities, electrical gear does not fail in a neat, predictable way. Instead, it changes slowly, and then it changes fast. Over time, loose connections, aging insulation, moisture intrusion, and corrosion create hotspots. Those hotspots usually start small and local, so standard visual checks miss them. Then, as load increases or operating cycles repeat, the problem accelerates.
Furthermore, many facilities push equipment hard. That is normal in business. However, normal operations can still expose weak points in switchgear, bus ducts, terminations, motor control centers, transformers, and panel boards. Even when everything “looks fine,” the internal temperature rise tells a different story.
At Kord Electric, we focus on electrical asset longevity for major property buildings and commercial and industrial sites. We do not treat thermography as a one time inspection and a paperwork exercise. We treat it as an ongoing risk reduction process, because the goal is simple: keep assets running longer and keep people safer.
Infrared thermography testing that finds problems before failure
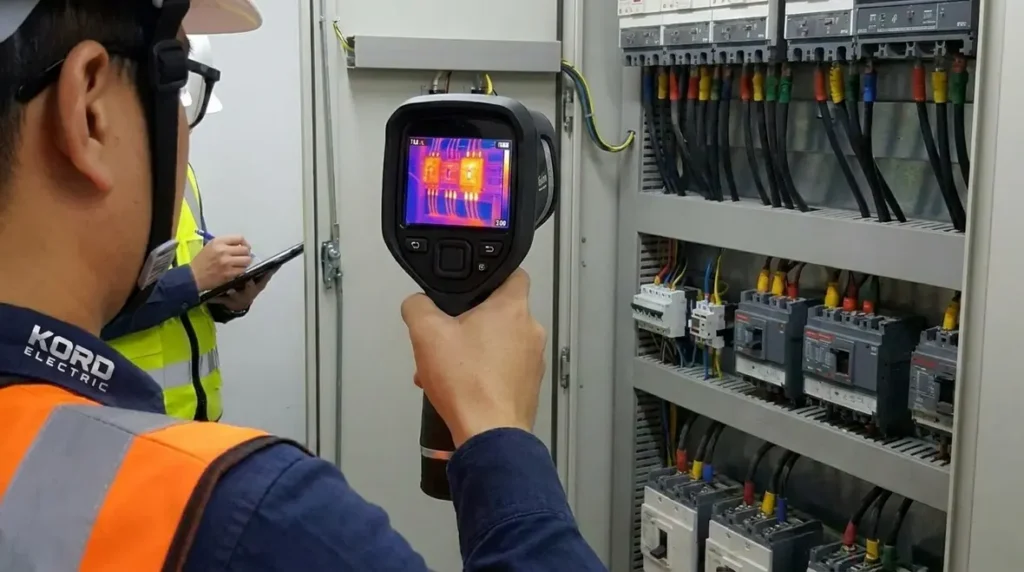
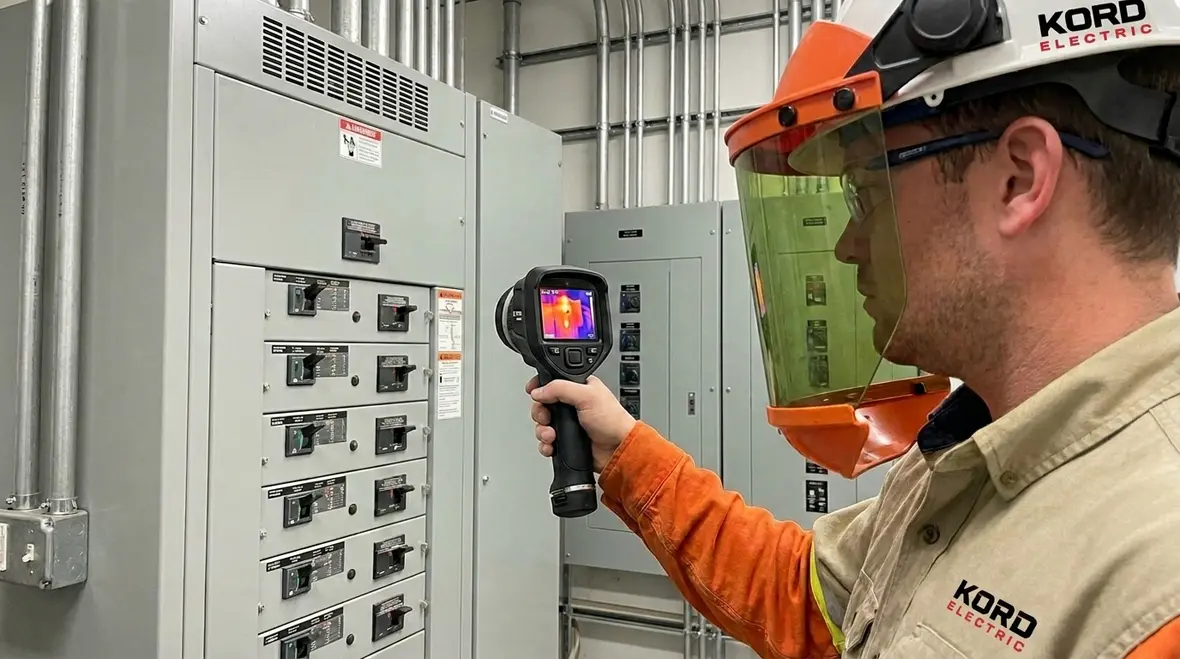
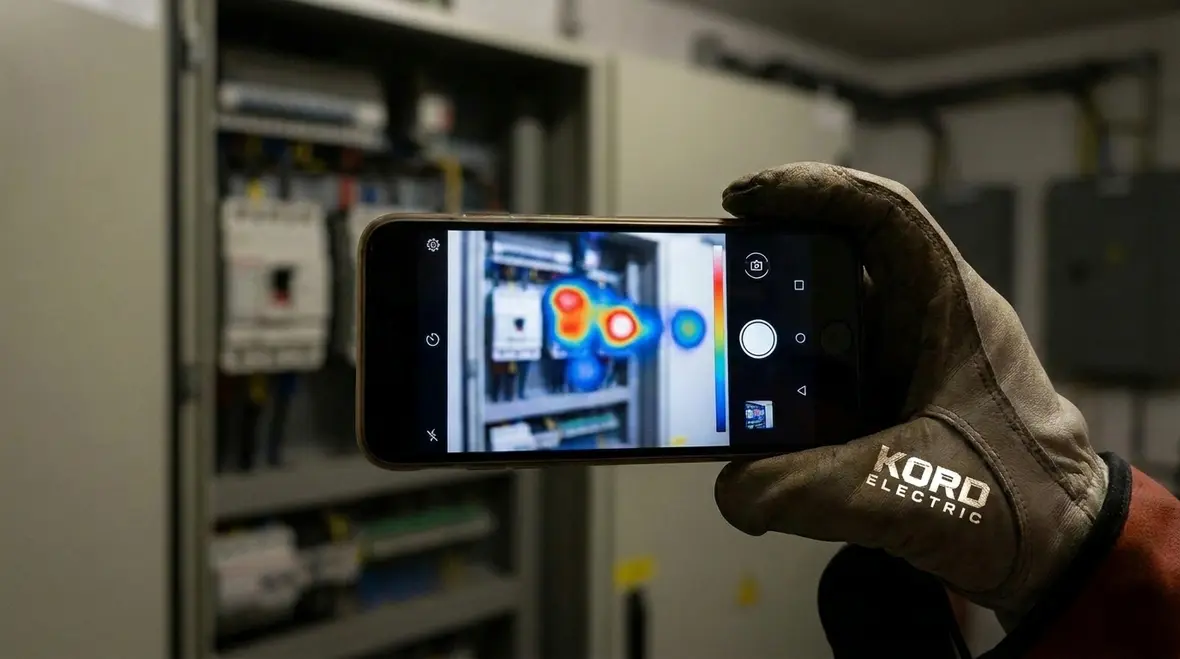
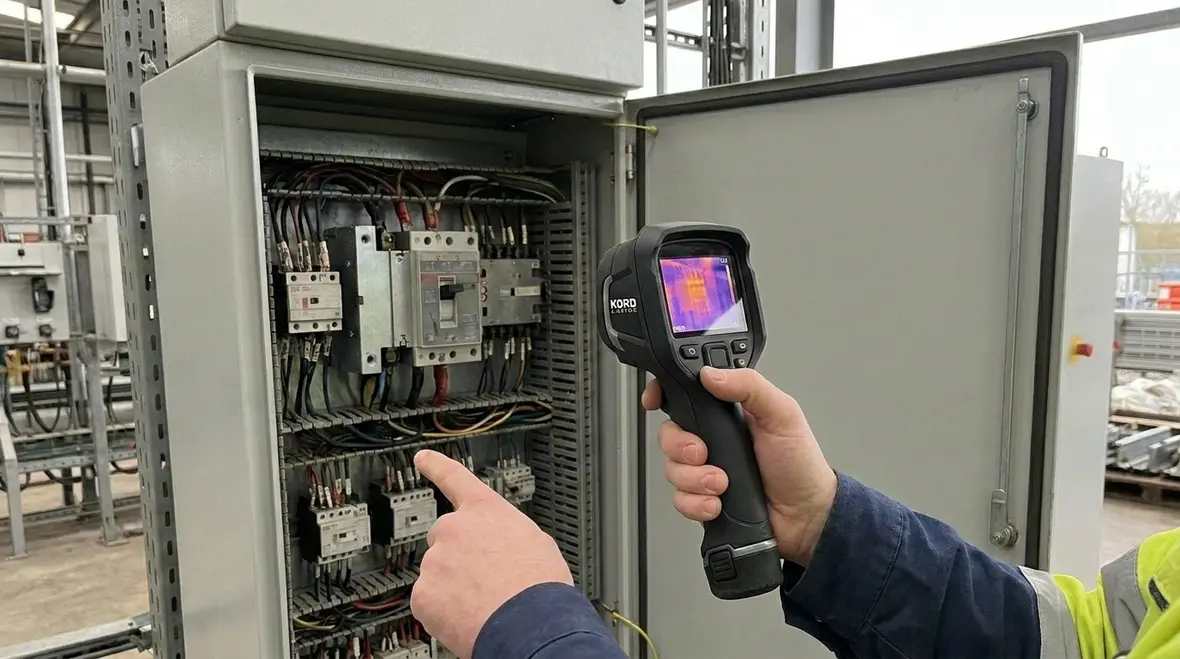
Infrared thermography works because warm surfaces radiate energy. When an electrical component runs hotter than it should, the camera captures a temperature pattern. Then our technicians interpret the data with context, such as load level, equipment design, and normal operating trends. As a result, we can often pinpoint where resistance, connection issues, or insulation deterioration exist.
To be clear, we do not “guess” based on one image. We compare readings across similar components, we account for operating conditions, and we document where the heat signature appears. If one lug or phase shows a clear difference, that difference matters. If a breaker shows uneven thermal behavior, it matters. If a bus section shows a gradual rise over repeat visits, it matters even more.
In addition, we use preventative infrared thermography testing as part of a broader maintenance strategy. So when our service staff explains the results, they connect the thermal findings to what electricians and engineers can verify during corrective work. It is like getting the plot details early, instead of waiting for the final act where something pops.
Common electrical hotspots we identify in switchgear and distribution
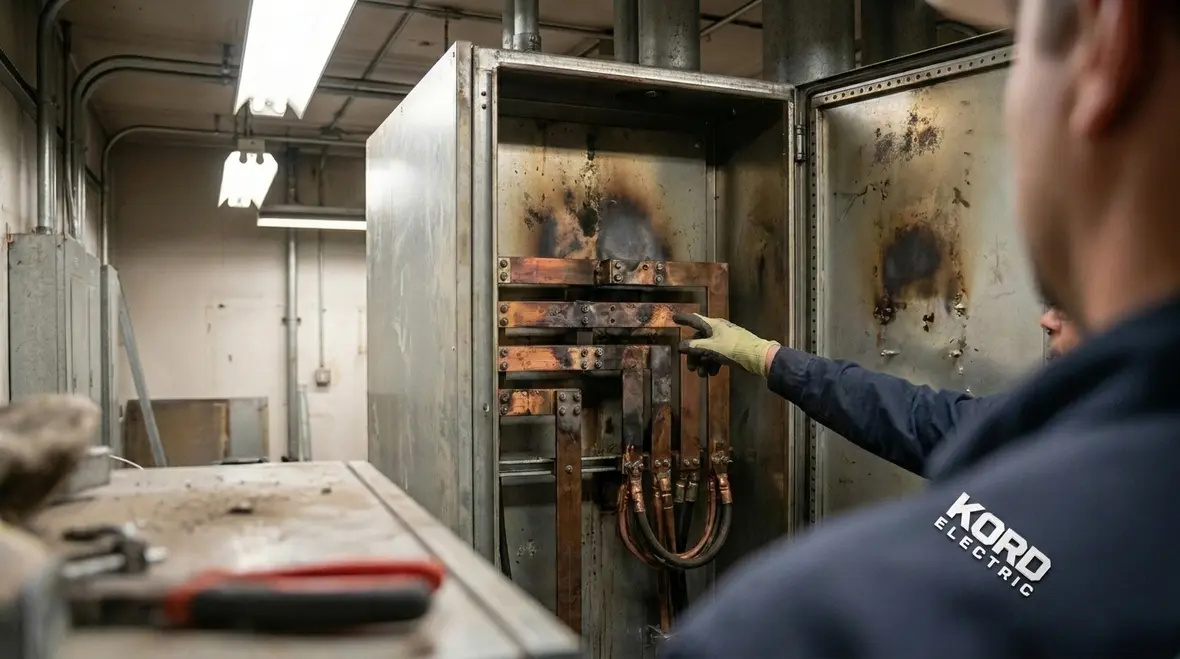
Many facilities assume the “big” equipment is always the safest. In reality, the high current paths and critical connections make switchgear and distribution gear prime targets for overheating. Below are common hazard types we identify through preventative infrared thermography testing.
- Loose terminations: Small gaps increase resistance, which produces higher heat at the connection.
- Worn or damaged conductors: Corrosion or insulation breakdown can raise surface temperatures.
- Phase imbalance: Uneven loading or partial failures show up as unequal thermal patterns.
- Failing breaker mechanisms: Mechanical issues can affect contact pressure and raise operating temperature.
- Bus duct and bus bar issues: Hot spots often appear at specific interfaces, not across the entire assembly.
- Transformer connections: High resistance at terminals can create early temperature rise before major defects.
Moreover, we help others understand that these hazards often do not announce themselves. People may hear nothing, see nothing, and still face rising risk. Heat leaves clues. Thermography turns those clues into actionable work orders.
How we interpret results while staying aligned with code expectations
Heat data only helps when it leads to responsible electrical decisions. That is why our team ties thermography findings into safe engineering practices and recognized electrical requirements. For example, our staff reviews how the facility maintains electrical systems and how inspections and maintenance support code intent. We also reference applicable requirements in the National Electrical Code, including sections that relate to safe installation, labeling, and inspection practices for electrical equipment.
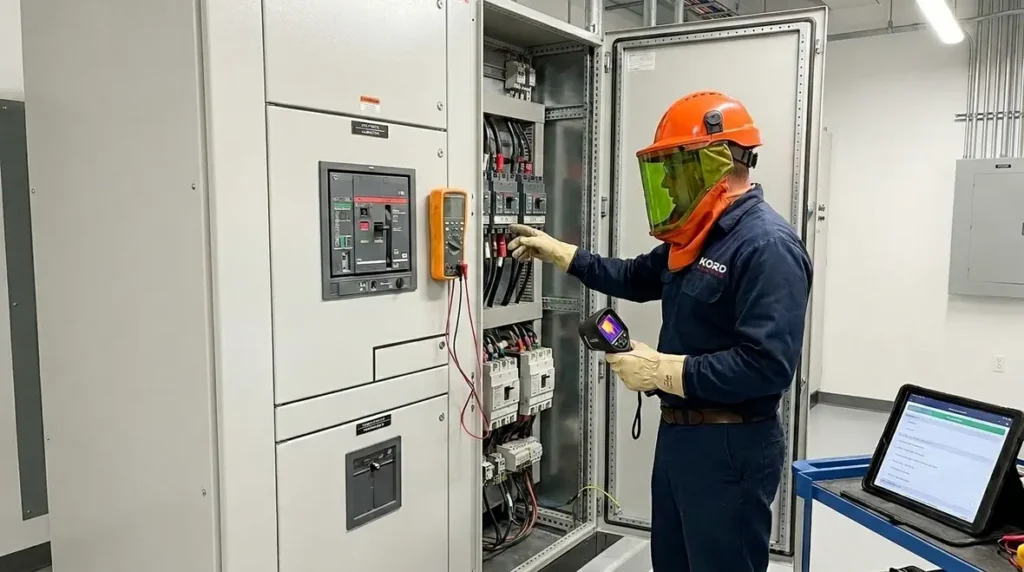
As discussed in our related content on NFPA 70 and the National Electrical Code for 2026, the NEC aims to protect people and property through structured requirements. For a deeper dive into how the NEC shapes everyday decisions, you can explore our article, “Understanding NFPA 70: The National Electrical Code Explained for 2026.” When we interpret infrared results, we consider how maintenance and inspection support safe operation. While thermography is not a replacement for testing or hands on inspection, it acts like an early warning system that supports proper upkeep.
Then, we produce a clear report that tells the facility what we saw, where we saw it, and what priority it should carry. After that, our technicians coordinate with the site team so the next steps do not stall. If corrective tightening is needed, we describe the likely source. If more detailed verification is required, we recommend it. In short, we convert thermal observations into a maintenance plan that makes sense.
Planning a preventative infrared thermography testing program
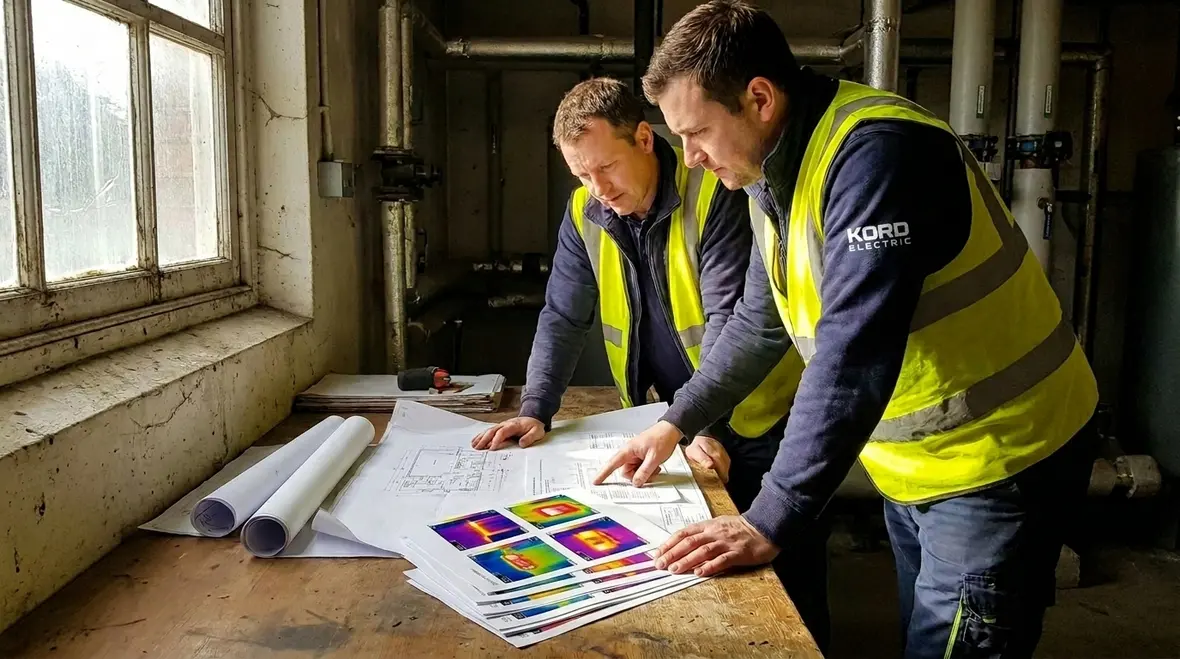
Commercial and industrial sites differ in load profile, environment, and equipment age. Therefore, we build a program that fits the real conditions of your facility. We often start with a baseline inspection. Then we schedule follow ups based on risk, criticality, and how equipment behaves during peak operation.
To avoid confusion, we define what we will test, when we will test it, and how we will compare results. Additionally, we coordinate access with your maintenance schedule, because downtime does not help anybody. When possible, we capture images under stable operating conditions so the readings reflect actual load, not a quiet moment where the equipment is barely awake.
Our technicians also consider site factors such as dust, humidity, and airflow obstructions. Those details change surface conditions and can affect readings. However, with consistent technique and good documentation, the comparisons remain useful over time.
And yes, we sometimes get asked if we can “just scan everything once a year and call it done.” That is like saying you can drive all year without checking your mirrors. It is technically possible, but it does not align with real risk management. Instead, we recommend a program that targets critical distribution pathways and known high stress assets, then expands based on results. For facilities building out a more structured electrical strategy, this approach fits naturally alongside broader initiatives like commercial and industrial electrical maintenance plans that keep systems reliable year after year.
What to do after the thermography report lands on your desk
Thermography only delivers value when it triggers action. Once our preventative infrared thermography testing report reaches your team, we help you prioritize corrective work. We typically separate findings by urgency, because some thermal differences can signal immediate danger while others point to issues that still need attention before they grow.
Next, we recommend verification methods that match the hazard type. For a suspected loose termination, field checks can confirm mechanical condition and torque needs. For suspected load imbalance, further analysis can confirm phase loading or operational schedules. For equipment with repeating hotspots, trending becomes essential so you do not treat the same problem as if it were a one time event.
Also, we support the site by explaining the findings clearly. Our expert service staff does not hide behind jargon. They connect the heat pattern to the likely electrical cause, so facility managers can make decisions with confidence.
Finally, we track outcomes. When corrective work gets completed, we follow up with new images to confirm improvement. That closes the loop and builds a record of asset health. Over time, trending shows which assets are stable, which need watchlist attention, and which require deeper intervention.
FAQ for commercial and industrial electrical thermography
Call Kord Electric for a calmer, safer electrical future
If you manage commercial and industrial electrical systems, you already know problems rarely announce themselves. Kord Electric helps you spot the early heat signatures with preventative infrared thermography testing, then we guide your next steps with clear explanations from our technicians and expert service staff. Contact us to schedule an initial baseline inspection or a targeted follow up for critical distribution areas. We will help you protect assets, reduce downtime risk, and keep operations steady, without drama and without surprise failures.
For facility leaders building a more comprehensive approach, preventative infrared thermography testing pairs naturally with services like Lighting Installation Services and other commercial and industrial electrical upgrades that keep infrastructure safe, efficient, and code aligned over time.